
Monitoring & Reports
PrivateLAN provides several pages to monitor the health of your network and to review what has happened on the system over time.
Dashboard
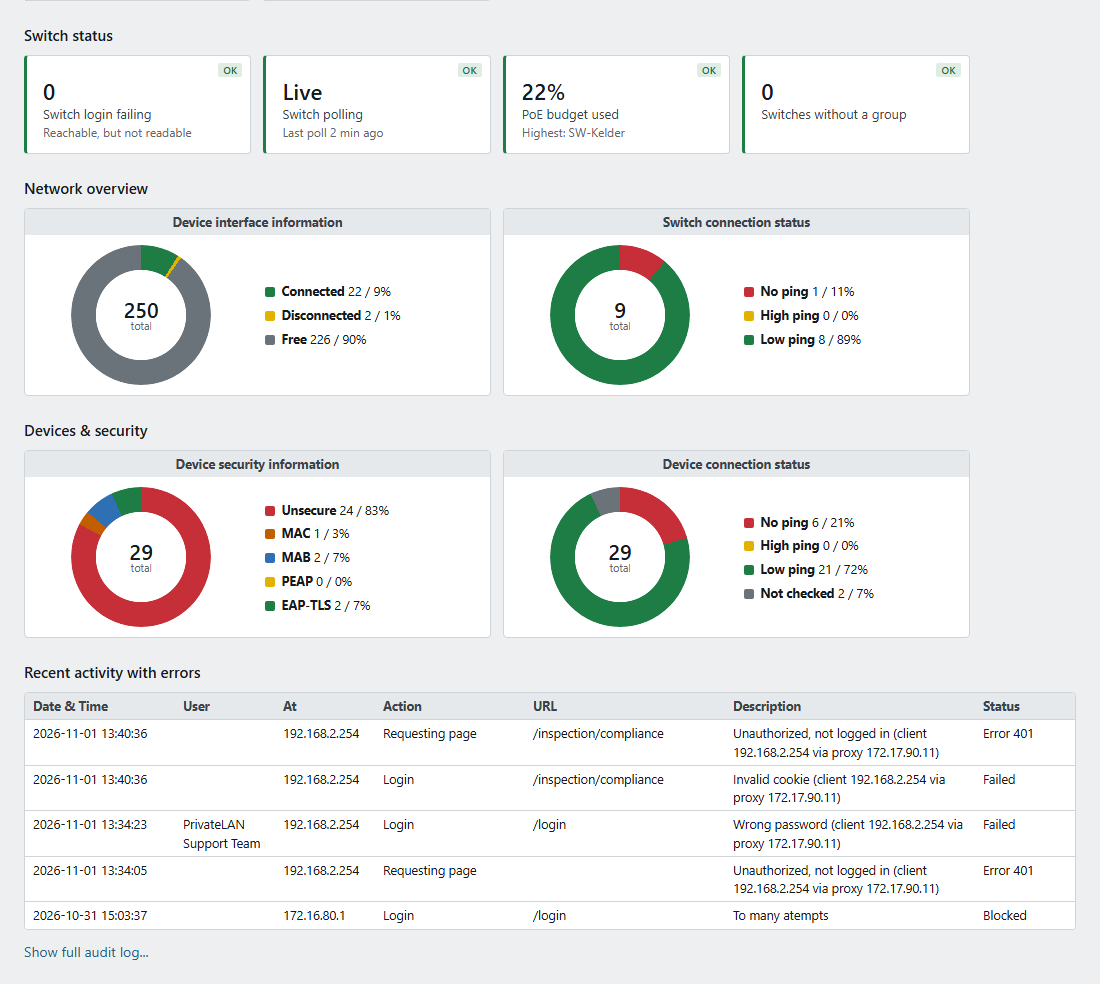
The dashboard gives an at-a-glance overview of your network using four charts:
- Device interface information — connected, disconnected and free device ports
- Device security information — breakdown of devices by security type (Unsecure, MAC, MAB, PEAP, EAP-TLS)
- Device connection status — devices with no ping, high ping, or normal ping response times
- Switch connection status — switch availability and latency
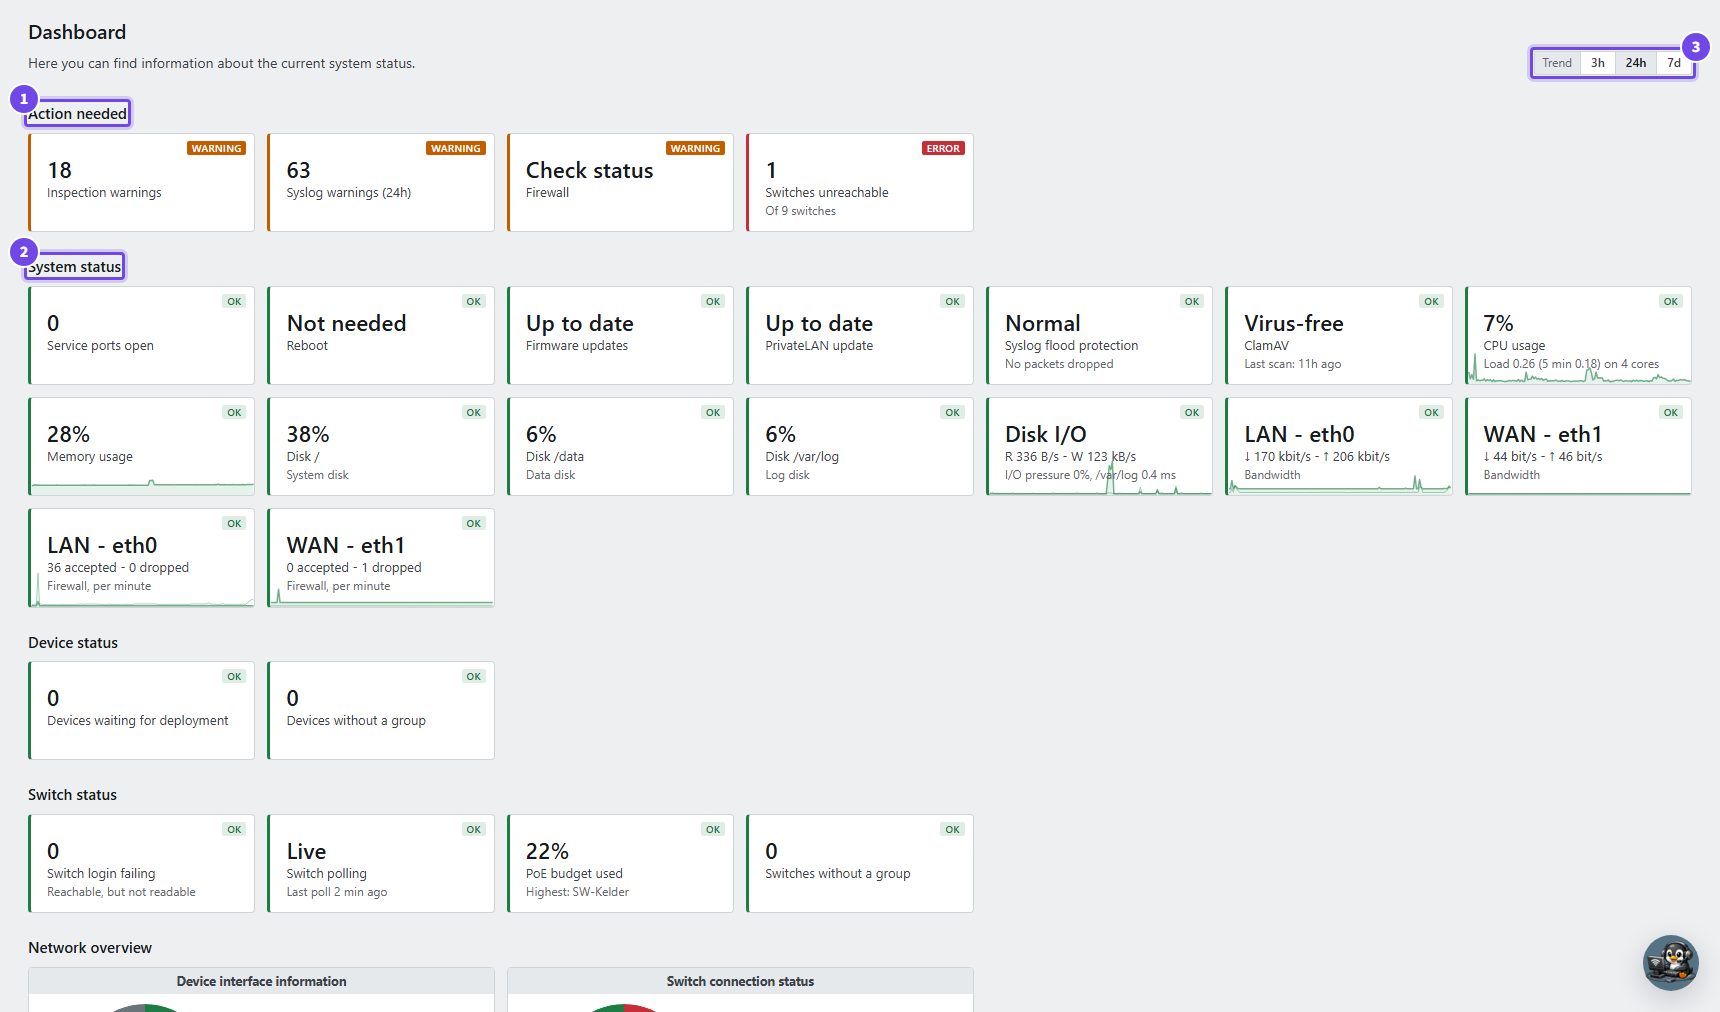
- Action needed — only what needs attention now
- System status — the appliance itself: updates, disks, processor, memory, network
- Trend — the window of the trend lines: 3 hours, 24 hours or 7 days
Above the charts, status tiles summarise the health of the appliance itself. Every tile carries an OK, Warning or Error badge in its top-right corner, and any tile that is not OK is grouped under "Action needed" at the top of the page. Alongside the tiles for updates, firewall and virus scanning, the resource tiles show:
- CPU usage — the current load average as a percentage of the available processor cores (warning from 70%, error from 100%)
- Memory usage — memory actually in use, not counting cache and buffers (warning from 80%, error from 90%)
- Disk usage — one tile per disk: the system disk, the data disk and the log disk (warning from 80%, error from 90%)
These are the same measurements the appliance uses for its own health reporting, read live each time the dashboard is opened.
Further tiles cover the appliance's own network connections:
- LAN - eth0 and WAN - eth1, marked Bandwidth — inbound (↓) and outbound (↑) traffic on each network interface, averaged over the last minute. These are informational and always carry an OK badge: no amount of traffic is by itself a fault. An interface that has no link says so instead of reporting zero traffic, and an interface the appliance does not have gets no tile at all.
- LAN - eth0 and WAN - eth1, marked Firewall, per minute — how many new connections the firewall accepted on each interface in the last minute, and how many packets it dropped: connection attempts no rule allows, including the honeypot ports on the LAN and traffic on the WAN claiming a local address. A sender usually retries a refused connection a few times, so one attempt can count more than once. The firewall never rejects traffic with an answer, it drops it silently, so there is no separate rejected figure. These tiles are informational as well: on the WAN side scanning from the internet never stops, and a scan from inside the LAN is reported by the honeypot alert. Syslog discarded by the flood protection is not included; it has its own tile.
- Syslog flood protection — whether the firewall is currently discarding syslog from a device that sends it faster than the appliance accepts. "Normal" means nothing is being discarded; a warning shows how many packets per minute are being dropped, so you can see that log messages are being lost, and how badly. The limit applies per sending device, so one very talkative switch cannot push the rest of your equipment out of the log.
Unlike the resource tiles above, these are measured once a minute in the background rather than at the moment the page is opened, so they add nothing to the time the dashboard takes to load. They appear as soon as the first measurement has been taken.
The Disk I/O tile shows how busy the disks are, where the disk tiles above show how full they are: how much is read (R) and written (W) per second across all disks, averaged over the last minute, and how long a disk operation took on the busiest disk. Its badge follows how long processes had to wait for the disks: a warning when that was more than a quarter of the last minute, an error above half of it. Like the network tiles it is measured once a minute in the background.
The CPU, memory, Disk I/O, bandwidth and firewall tiles also show a line in the background with how the value developed; on a firewall tile the main line is the dropped packets. The Trend switch at the top right of the dashboard chooses the period: the last 3 hours, 24 hours or 7 days; your browser remembers the choice. Each point of the line is the highest value in its part of the period (per minute, per 10 minutes or per hour), so a short peak stays visible over 7 days too. CPU and memory are drawn on a fixed scale from 0 to 100%, so a quiet appliance shows a flat line along the bottom; the traffic, firewall and disk lines scale to the busiest moment in the period, and hovering over the tile shows that peak. A gap in the line is a period in which no measurement was taken, for example because the appliance was switched off. The appliance keeps these measurements for seven days; on a new appliance the line appears once the first measurements have been taken.
A Switch status section covers the switches themselves, with the same badges:
- Switches unreachable — switches that do not answer ping
- Switch login failing — switches that do answer ping, but whose details can no longer be read because the login to the switch is failing
- Switch polling — whether switch data is still being refreshed in the background; "Stale" means every other switch figure on the page is out of date too
- PoE budget used — the highest power consumption against a switch's own PoE budget, so you see a full budget before the next access point or camera fails to power up
- Switches without a group — switches not yet assigned to a switch group
Status bar
The bar at the top of every page shows the state of the appliance without taking up room:
- Clock and date — always visible, in the appliance's own time.
- Icons — background tasks, processor load (one bar per processor core), the number of active users, the software version and the license. Click an icon for the details. The background tasks only list routine jobs when one of them failed.
- What needs attention stays in words — Reboot required and Update available take you straight to System > Update, and the license icon shows how many days are left once fewer than thirty remain.
- Software version — click it for What's new, the release notes of the series you are running.

The background tasks, processor load and active users are only shown to users with the system-status role (administrators have it automatically); see Users & Account Security. Everyone else sees the clock, the software version and the license, reboot and update notices. After ten minutes without activity the bar stops refreshing and resumes as soon as you move the mouse or press a key.
Notifications
The bell in the status bar holds short notes that users leave for each other, for example "switch-netgear is removed for maintenance, back next week". There is no recipient: every user with the notifications role sees every notification. A number on the bell counts the notes from other users you have not seen yet; opening the bell marks them as read.
- Add notification (role notifications-add) asks for the text, at most 500 characters, and the date until which it is shown: ninety days ahead unless you choose another, at most a year. After that date the notification disappears by itself.
- Remove takes a notification away for every user. You can always remove your own; removing someone else's needs the notifications-remove-others role. Administrators can do both.
- A user can have at most twenty notifications at a time.
- Do not put passwords or keys in a notification: everyone with the role can read it.
Placing and removing a notification is recorded in the audit log. The roles are described under Users & Account Security.
Inspection
The inspection pages look for situations that may need attention. Inspection opens an overview with the number of findings each check has right now, and each check has its own page under it: Ports, Network, SSL and Compliance. The dashboard's inspection tile links to this overview.

Every user with the inspection role can view these pages. Acting on a finding — disabling a port, acknowledging or muting an event, muting or rescanning a device, or having a switch read again — needs the inspection edit role.
The inspection pages are part of the Reports & Inspection license option.
Port inspection
Inspection > Ports lists the switch ports that are in use where nothing is expected, or down where something is expected:
- Unexpected port usage — ports with an active connection but no device assigned. When the MAC address found on the port belongs to no known device, the device can be added directly on that port, with the MAC addresses filled in, as on the Deployment page (including the Ctrl and Ctrl+Shift choices on Add). The VLAN column shows the VLAN the port was in at the last poll of the switch. When that VLAN belongs to exactly one device group, the new device form selects that device group and VLAN for you; when it belongs to several, the form names them. Ports that are not needed can be disabled directly from this page
- Disconnected ports — marked ports (trunk, SFP or non-device) that are not connected, including ports the switch has shut down itself (err-disabled) after a fault or a security violation. A "Type" column shows what each port is (for example [TRUNK], [SFP] or [ND]). Trunk uplinks are flagged to reconnect; unused non-device and SFP ports can be disabled directly from this page
- Active service ports — service ports that are open for maintenance right now, with the time left before they close by themselves
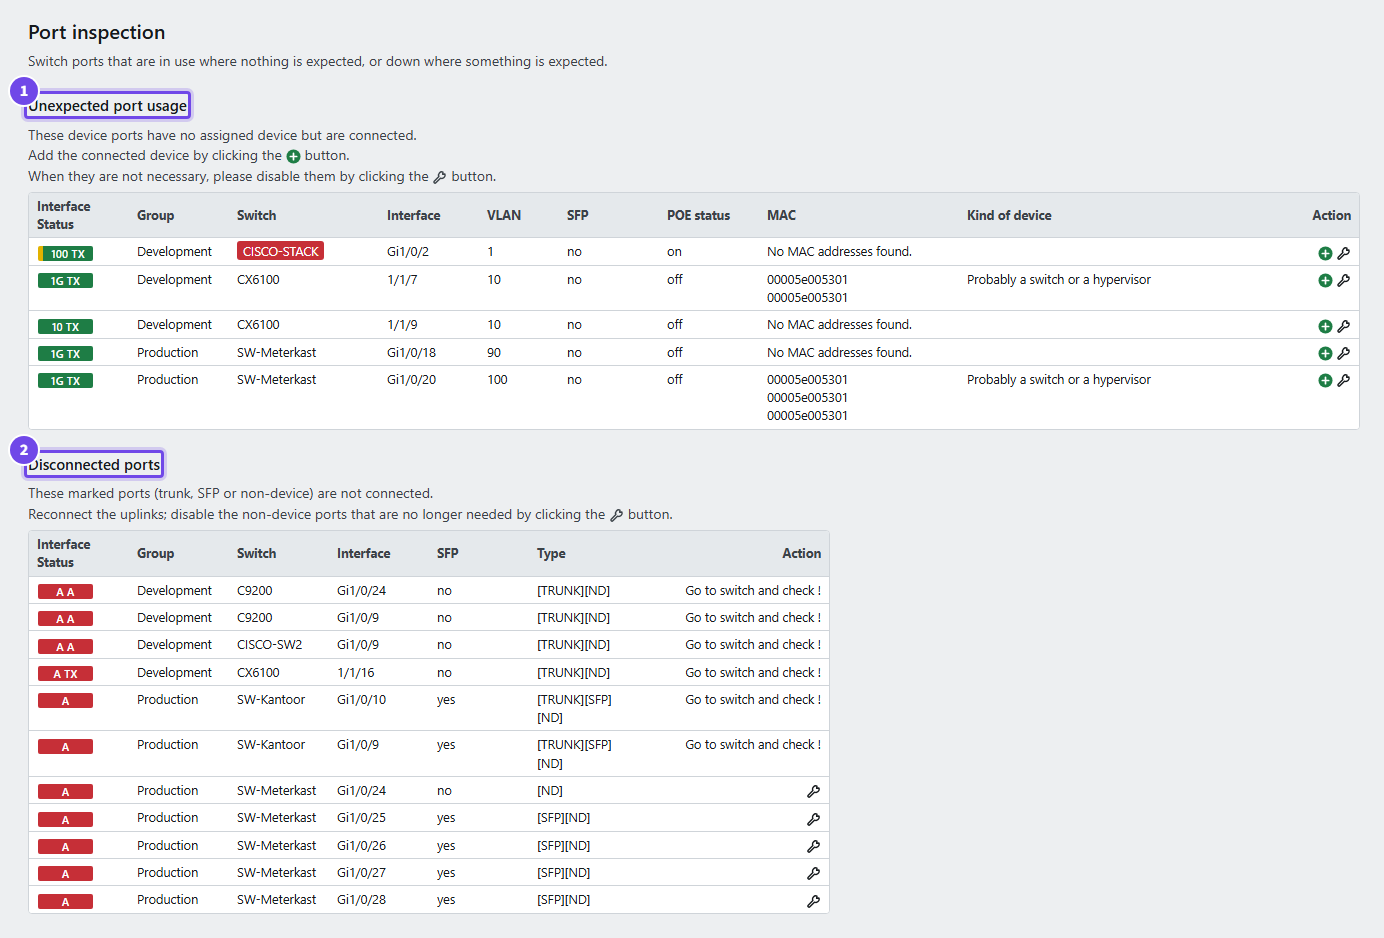
- Unexpected port usage — ports in use without a device assigned
- Disconnected ports — marked ports that are down
Network inspection
Inspection > Network shows anomalies such as high ping times. An event can be acknowledged, or muted to hide it and unmuted to show it again. The threshold used to flag a "high ping" can be configured (10-1000 ms).
SSL inspection
Most devices have a web interface or another management page, and the certificate PrivateLAN issues a device for 802.1x can secure that page as well. Inspection > SSL checks every five minutes that every device keeps its unsecure port closed (by default port 80) and offers the certificate PrivateLAN issued it on its secure port (by default port 443), with the right hostname in it — and, for a device with a static address, the right IP address. Only devices that answered the last ping are checked.
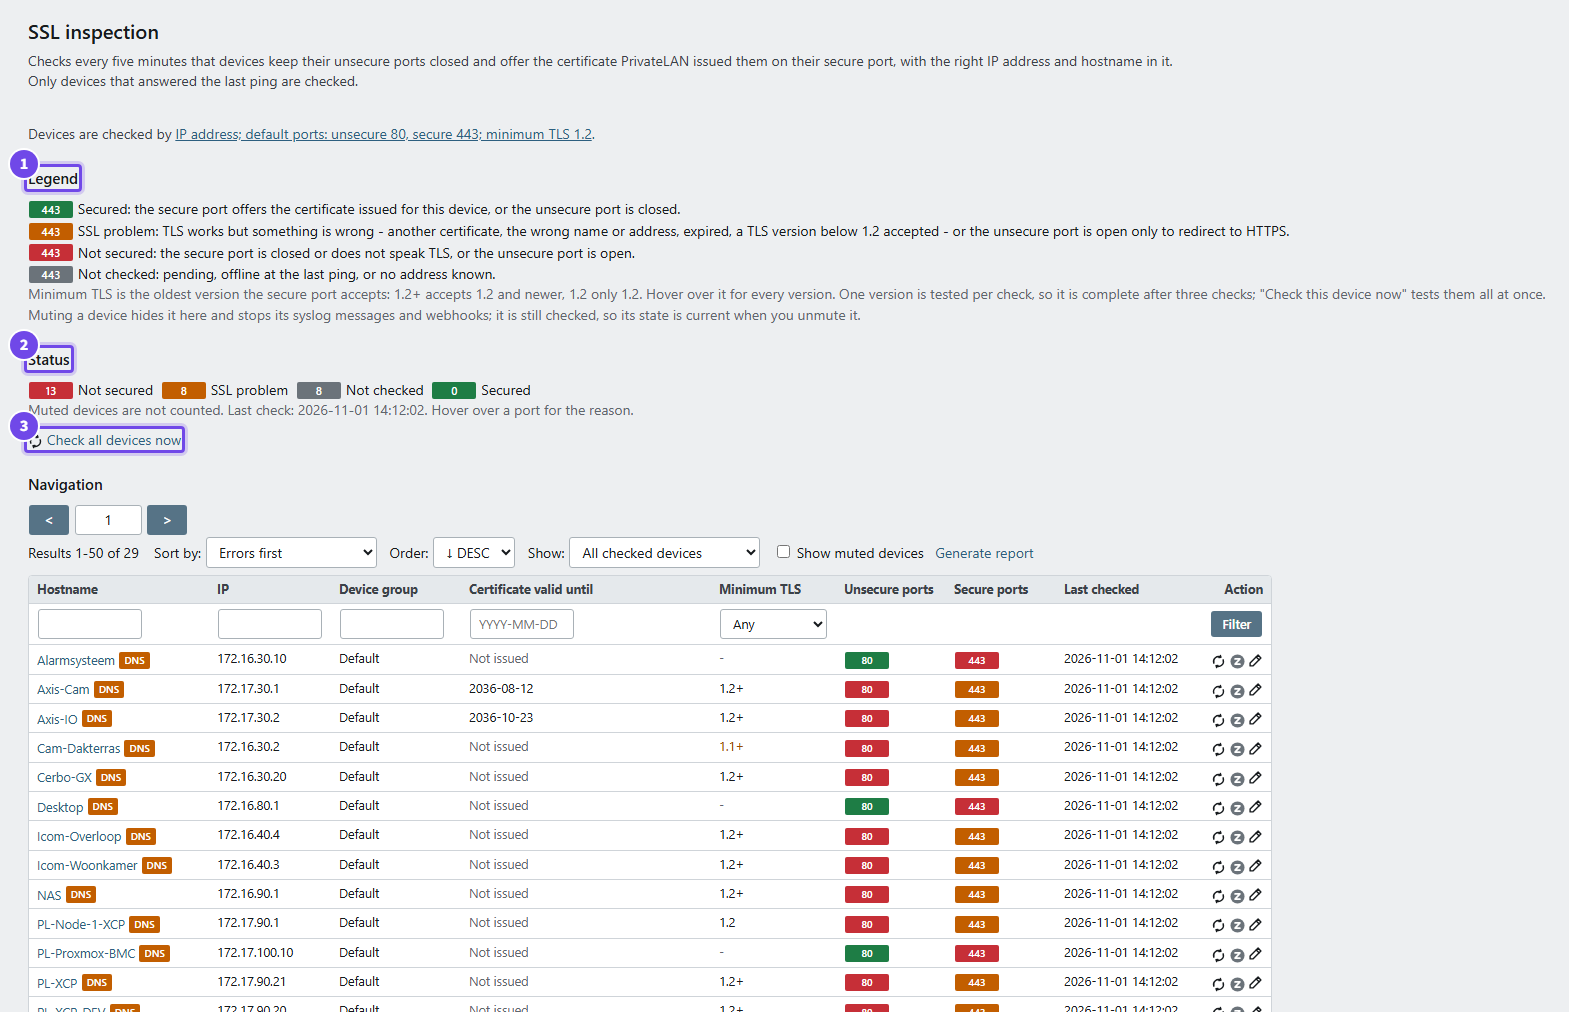
- Legend — what each colour of a port badge means
- Status — the number of devices in each state
- Check all devices now — runs the check straight away
Every port is shown as a coloured label; hover over it for the reason:
- Green — the secure port offers the issued certificate, or the unsecure port is closed
- Orange — encryption works, but something is not right: a self-signed certificate or one from another authority, the certificate of another device or one that has since been replaced, the wrong name or address, an expired certificate, or a TLS version below the minimum that is still accepted. An unsecure port that is open but only redirects to HTTPS on the same device is also orange
- Red — the secure port is closed or does not use encryption, or the unsecure port is open
- Grey — not checked yet, offline at the last ping, or no address known
The overview has the same navigation, filters and sort order as the device list, and can be sorted with the errors first. The Certificate valid until column shows until when each device's certificate is valid; hover over the date to see when it was issued. You can search on part of the date (for example 2036 or 2036-08) and sort on it.
Minimum TLS. Project specifications often require at least TLS 1.2, with TLS 1.0 and 1.1 blocked. A device that supports several versions uses the newest one it shares with the browser, so whether it still accepts an older one only shows when that version is offered on its own. The Minimum TLS column shows the oldest version the secure port accepts: 1.2+ means TLS 1.2 and newer, 1.2 only TLS 1.2, 1.3 only TLS 1.3. Hover over it to see every version that is accepted or refused. Each check tests one older version, so the column shows Testing for the first few checks and is complete within fifteen minutes; Check this device now tests every version at once. TLS 1.3 needs no test of its own, because every check already shows whether a device supports it. You can filter on the column — for example on every device below the minimum — and sort on it, oldest version first. SSL 3.0 is not tested, because the appliance itself no longer supports it.
The minimum is set with Minimum TLS version in the settings: TLS 1.2 by default, or TLS 1.3. A secure port that also accepts an older version is orange, even when it prefers a newer one, and its value in the column is orange as well.
Ports. The default ports are set at the top of the page: one unsecure and one secure port. A device group can use other ports, or "none" — for example for workstations without a web interface — and a single device can override its group. Only TCP is checked. The port fields on the edit page of a device or device group are only shown to users with the inspection-edit role, since setting them to "none" takes devices out of the check.
Changing the settings. The line under the page introduction shows how devices are checked, the default ports and the minimum TLS version. Users with the inspection-ssl-config role click it to change these settings in a dialog; saving a change checks every device again. A new minimum TLS version keeps the versions already found, so it applies within a minute.
IP or DNS. Devices are checked by IP address by default: the certificate has to hold the hostname and, for a device with a static address, the address as well. A device whose address comes from DHCP is issued its certificate without an address, because that address changes with the lease. Users with the inspection-ssl-config role can switch to DNS checks: the hostname is then looked up with the DNS server set for the LAN interface, the check connects to the address that comes back, and the certificate has to hold the name. DNS checks can only be chosen when a DNS server is set and answers; the page says so when that is not the case. An optional DNS suffix completes short hostnames. Whenever a DNS server is available, a small DNS label next to the hostname also shows whether the name and the address agree with DNS.
Muting. A device can be muted: it disappears from the overview and sends no syslog messages or webhooks, but it is still checked, so its status is current when you unmute it. Tick Show muted devices to see muted devices again.
Alerts. A finding is sent to syslog once — not every five minutes — and once more every morning at 09:00 while it is still there, so a standing problem does not wake anyone at night. Its recovery is logged once as well. Webhooks are available for an unsecure port that is open, an SSL problem and a device that has recovered; see the webhooks section of the API documentation.
Certificates. New device certificates contain the hostname and, for a device with a static address, the IP address — and with a DNS suffix also the complete name — so a browser accepts them when you open the device by name. Certificates issued before keep their old content until they are issued again; the check shows which ones that applies to.
Configuration compliance
Inspection > Compliance compares the configuration each switch port should have with the configuration it actually has, and colours every line as correct, different, missing or unexpected. The expected configuration is built from the same templates that program the port, and the actual configuration comes from the regular switch poll, so opening the page does not contact any switch. You can compare all switches, one switch group or a single switch, and ask for a switch to be read again if its data looks old. Per switch it also checks whether the switch uses the appliance as its RADIUS server and sends its logging to the appliance — and whether it does so by IP address or by DNS name — and whether a time server is configured. Each of the DNS names System > Networking asks you to point at the appliance counts: app.privatelan.nl, radius.privatelan.nl and pki.privatelan.nl. The names are compared as written; the report does not look them up in DNS.
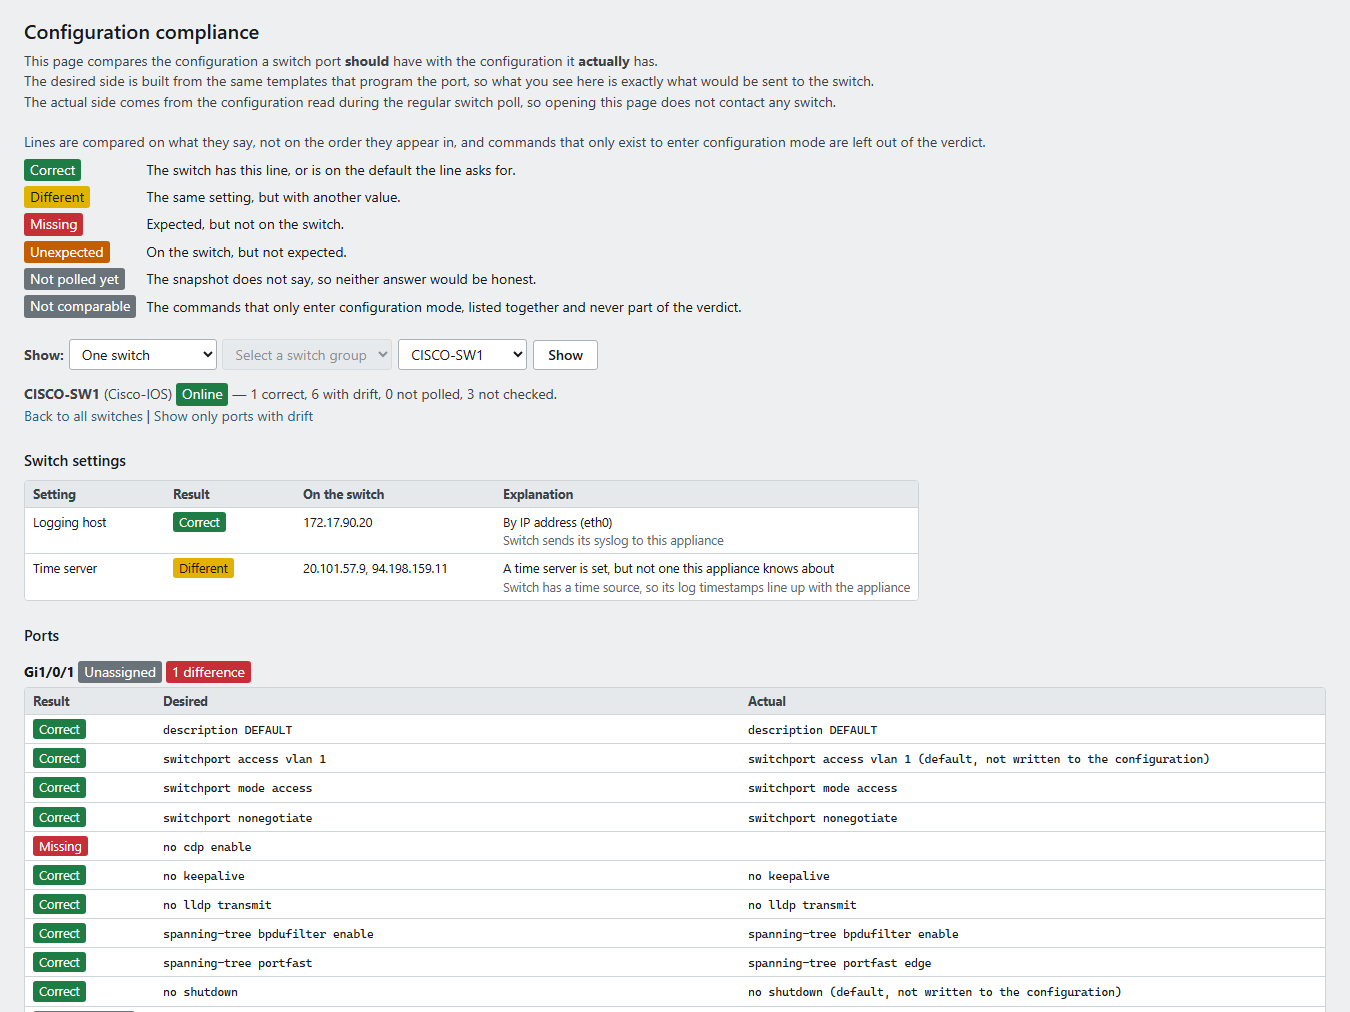
The comparison follows how switches actually write their configuration down: a port that a template shuts down and brings back up is judged on the state it ends in, settings a switch leaves out while they are on their default value — an access port in VLAN 1, for example — count as correct, and the commands that only enter configuration mode are grouped into a single line rather than listed one by one. A switch that the appliance cannot reach, or has never read, is marked as such with the same status colour the switch overview uses, instead of having all of its ports counted as drift.
A drifting port can also be put right from this page: each one gets a fix button that programs that device's ports again with the configuration they should have, and a second button does the same for every drifting device on the switch, one after another. Both ask for confirmation first — a port is briefly taken down while its configuration is rewritten — and both are only available to users allowed to run operational actions on devices.
The compliance page used to be under Reports; an old link or bookmark to it still opens the new page.
Reports
Reports give an overview of the network to view, print or download — for documentation, a handover or an audit. They are part of the Reports & Inspection license option, the same option as the inspection pages.
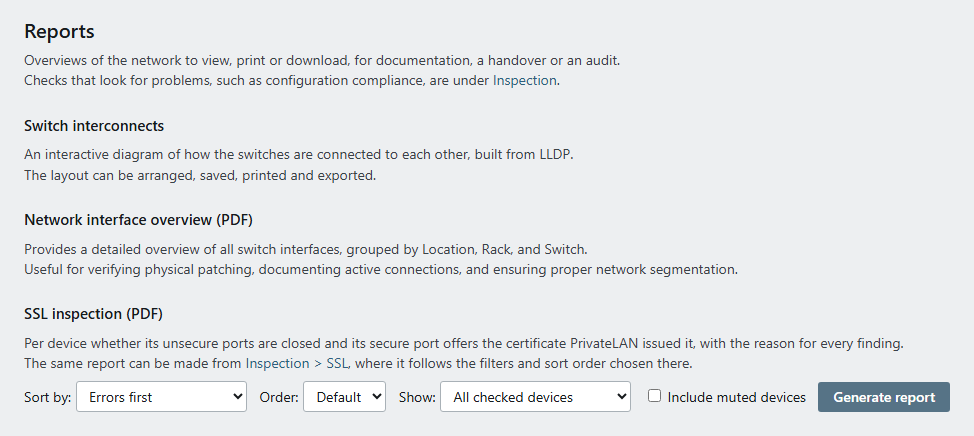
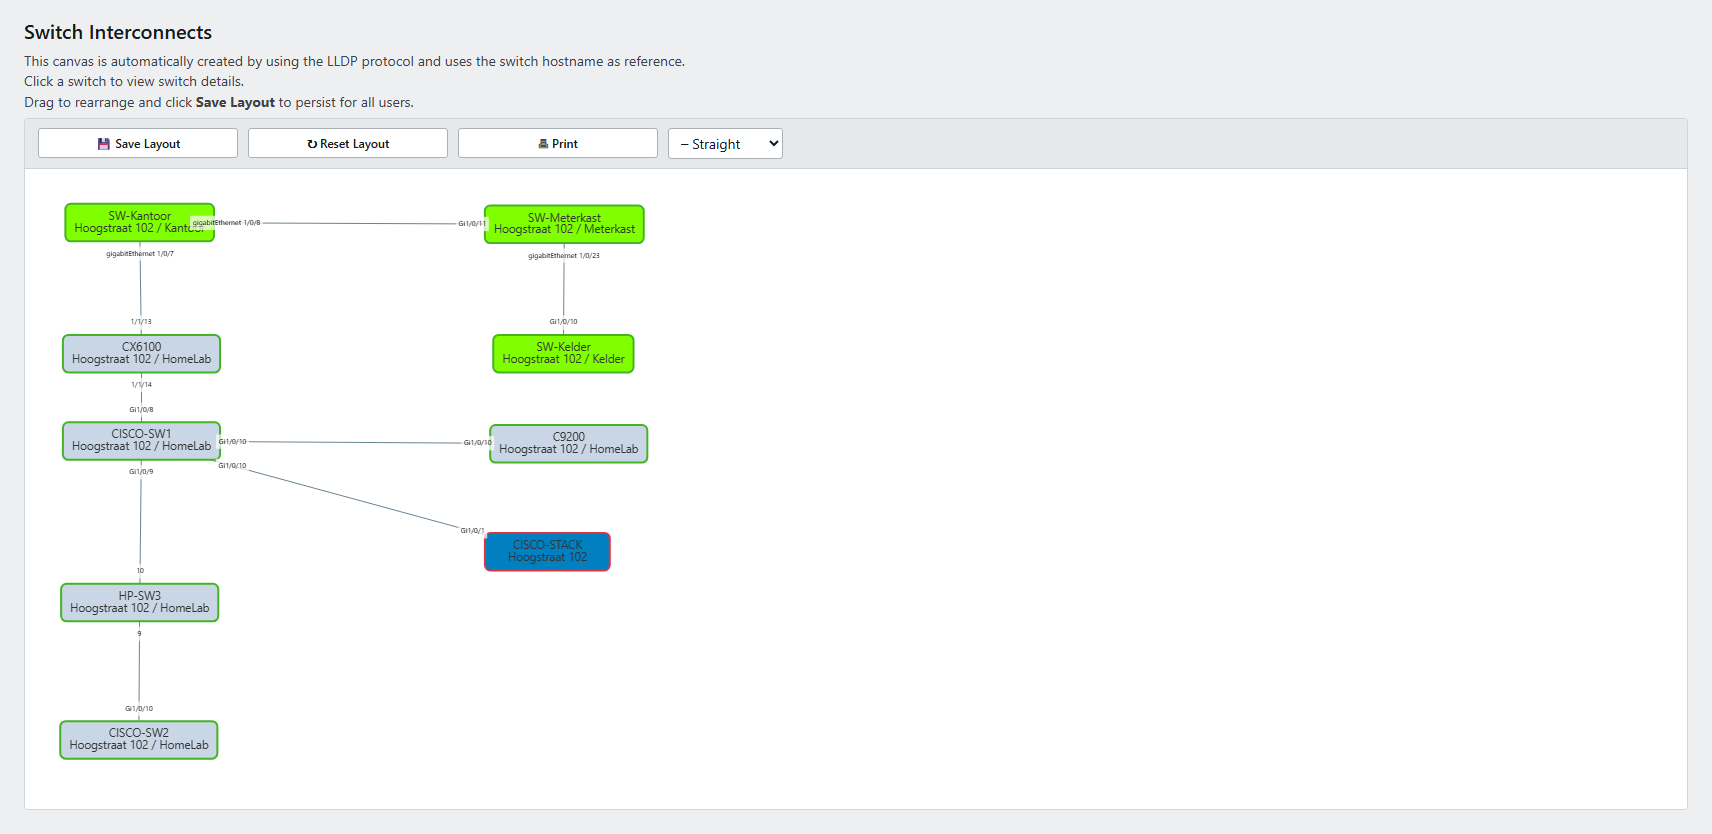
- Switch interconnects — an interactive diagram of how your switches are connected to each other, based on LLDP data. Switches can be color-coded, dragged into a custom layout, and the layout can be saved. The diagram can be printed or exported.
- Network interface overview — a downloadable PDF report listing all switch interfaces
- SSL inspection — a PDF of the SSL inspection findings, with the reason for every finding and the TLS versions of every device written out. Make it from the Reports page, choosing the sort order there, or with Generate report on the SSL inspection page, where it follows the filters and sort order you have chosen. It also needs the inspection role
Both PDF reports carry the logo and colours of the appliance's brand, the same as the web interface. Every page shows the report name, the project and the page number, and a table that continues on the next page repeats its column headings. The network interface overview starts each switch on a new page and names that switch at the top of every page it covers.
Under its details, every switch gets a drawing of its front panel, made from what the switch itself reported at its last check. Each port is drawn in its place with its number, in the colours of the interface overview:
- green for a connected port, with a yellow left edge when it delivers PoE
- a red rim for a port without a link
- grey for a disabled port
- white when the status is unknown
- blue for a service port
The first page of the report explains these colours in its legend, next to the status icons. The management and console ports are left out. A stack gets one panel per unit, in the order in which the units are cabled. When the switch reports its stack cabling, the cables are drawn beside the panels, and a cable without a link is named under the drawing. For a model whose port layout has not been checked yet, the report says so under the drawing. It then uses the most common layout: odd ports on the top row, even ports below, and the fibre ports on the right.
Audit log
The audit log records every administrative action performed in PrivateLAN: who did what, when, from which IP address, and with what result. Entries can be filtered and sorted by date, user, action, status and priority. Log retention is configurable (1-365 days, default 28 days).
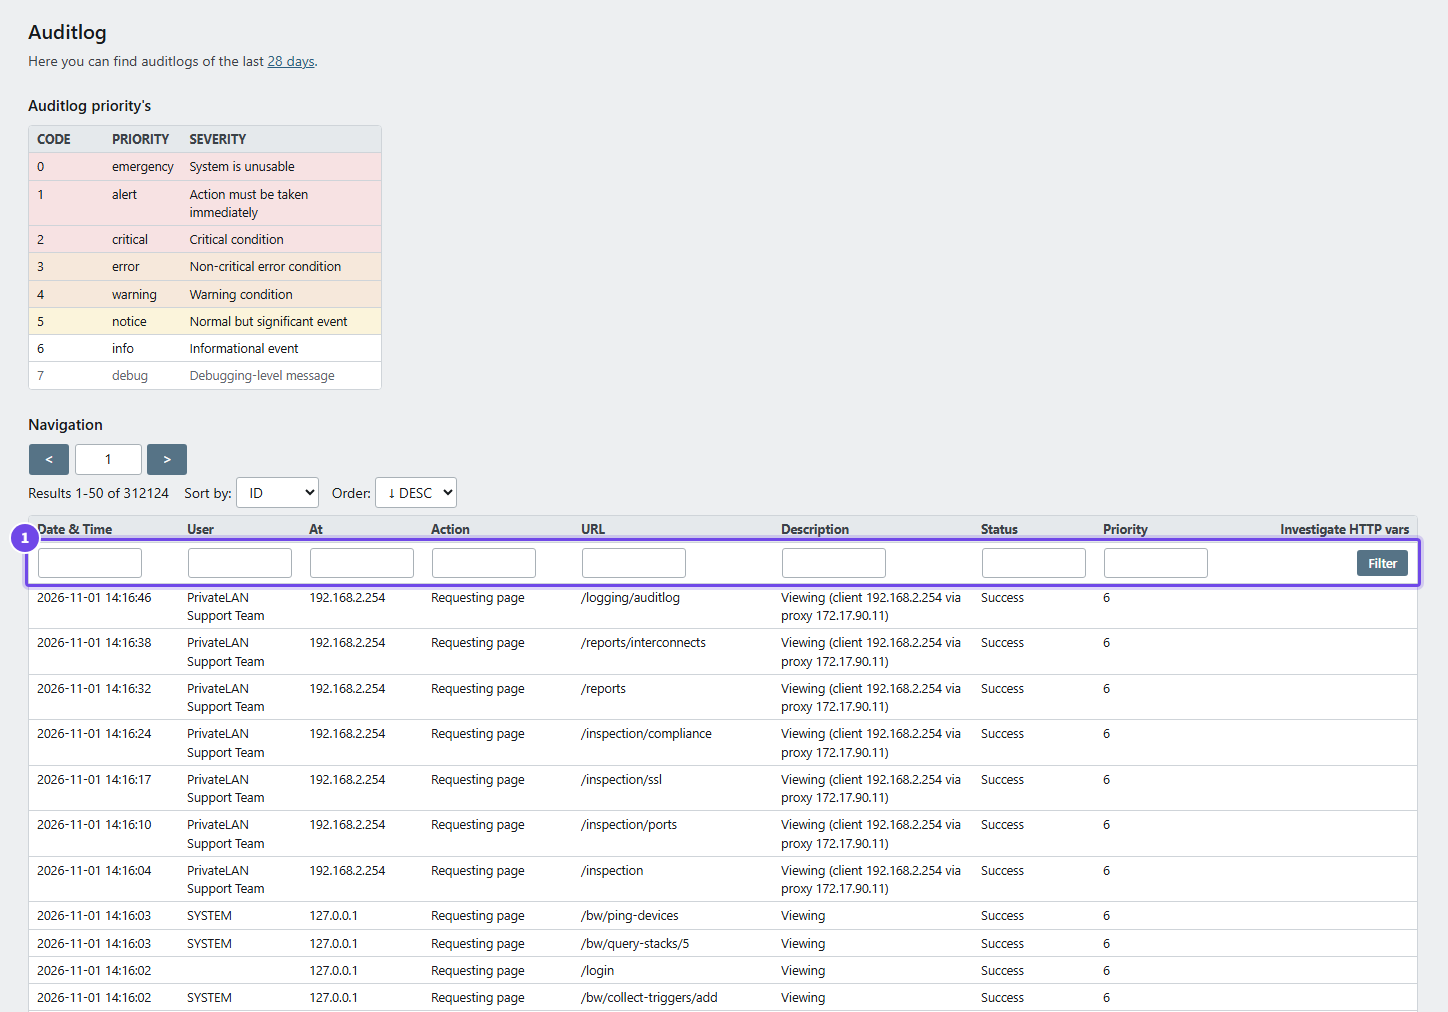
- Filter — on date, user, address, action, page, description, status and priority
Each entry keeps the name the user had at the time of the action. Deleting a user therefore does not remove the name from their earlier entries; they are shown with "(deleted)" after the name until they fall outside the retention period.
Honeypot detection
PrivateLAN traps connection attempts to a small set of decoy network services on its local network interface — legacy protocols such as FTP and Telnet that the appliance never actually offers. No legitimate device on your network has a reason to try them, so any attempt is treated as a security event: it is written to the audit log as a Honeypot entry, forwarded through syslog like any other security event when forwarding is enabled, and can trigger its own webhook so you can alert on it or act automatically. See the webhooks section of the API documentation for the honeypot.triggered event.
Syslog
PrivateLAN can receive syslog messages from your network equipment, such as switches and access points, on port 514. The syslog page lets you check whether the syslog receiver is running, and search received messages by timestamp, source, message content, priority and facility. Log retention is configurable (1-365 days).
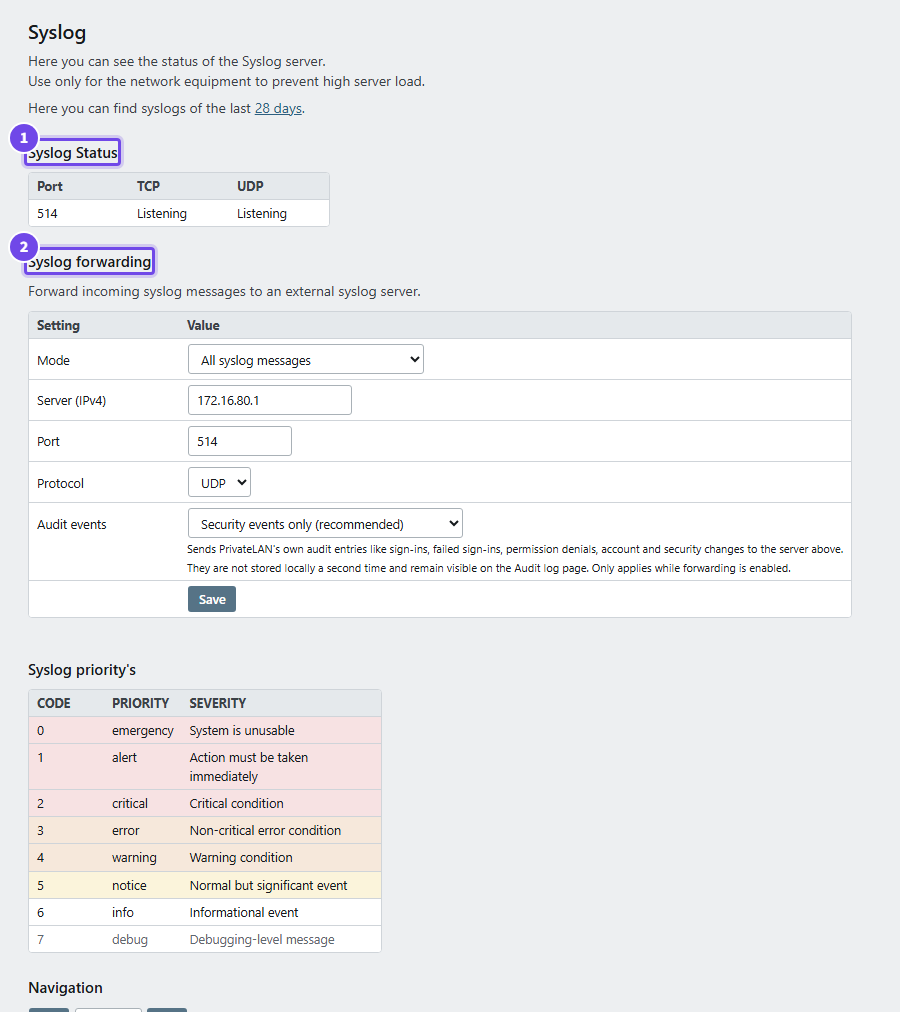
- Syslog Status — whether the receiver listens on port 514
- Syslog forwarding — send the messages on to an external syslog server
Syslog is intended for network equipment only — sending logs from many servers or workstations can overload the appliance.
